
VPIP and PFR: What Your Stats Reveal About Your Poker Leaks
Two numbers tell most of the story about why a poker player loses. Learn what VPIP and PFR mean, where yours probably are, and where they need to be.
No credit card required.
What Is VPIP? The First Number That Reveals Everything
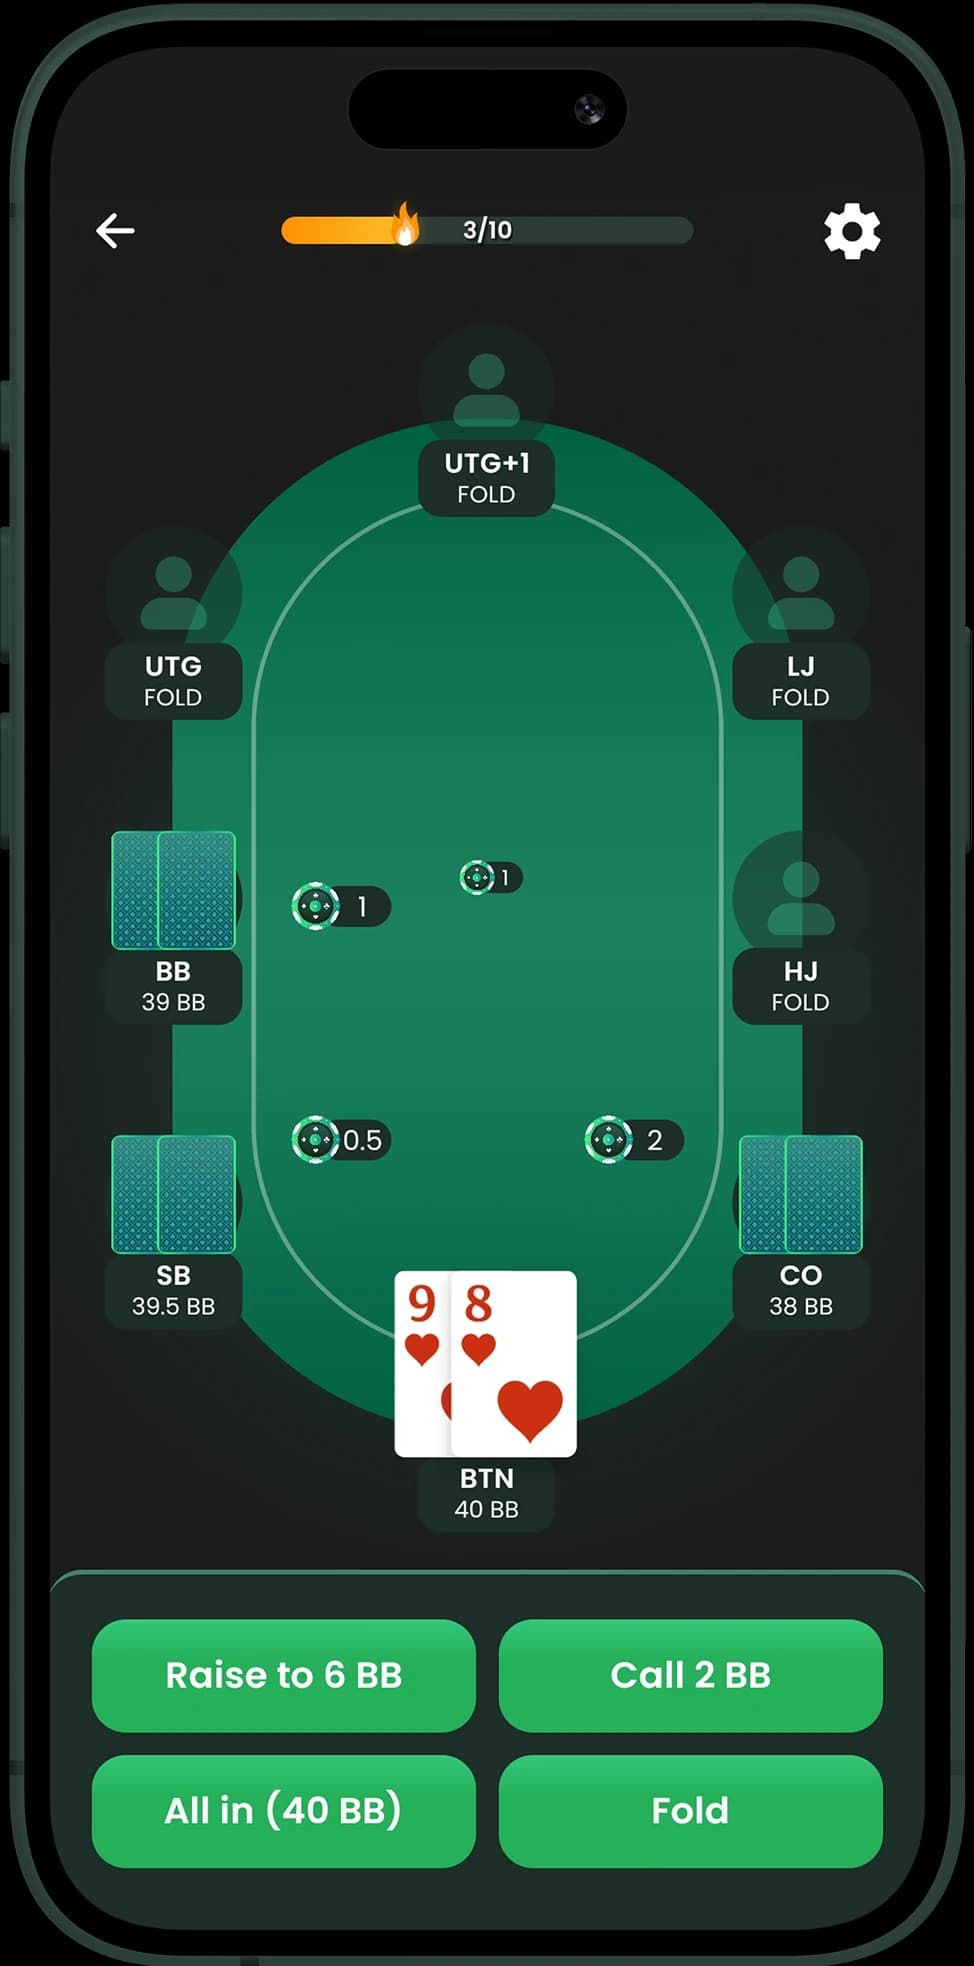
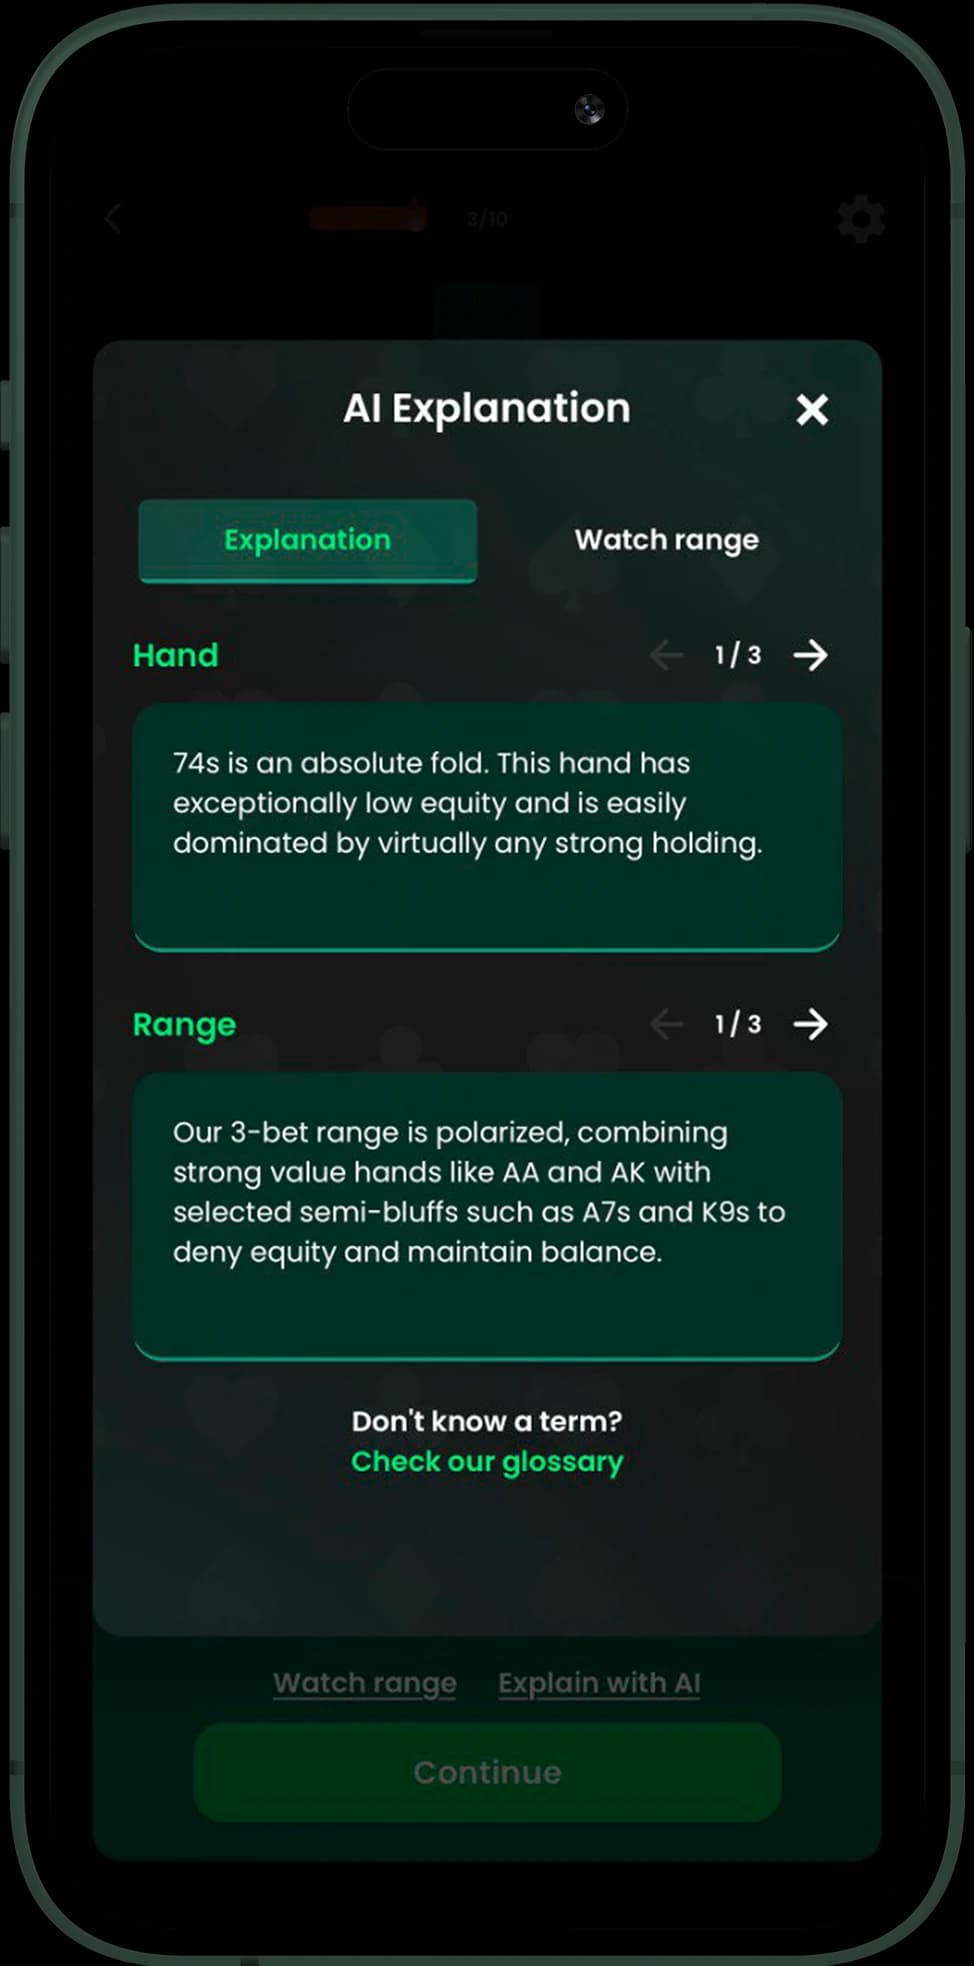
VPIP stands for Voluntarily Put money In Pot. It's the percentage of hands where you willingly invest money preflop — by calling, raising, or 3-betting. A VPIP of 25% means you play 25% of dealt hands. VPIP is the single most revealing statistic in poker because hand selection is the foundation of all preflop strategy. Too high a VPIP and you're playing too many hands. Too low and you're folding profitable situations. Most winning players at typical stakes have a VPIP between 20-28%.
What Is PFR? The Number That Reveals Aggression
Pre-Flop Raise — how often you're the aggressor
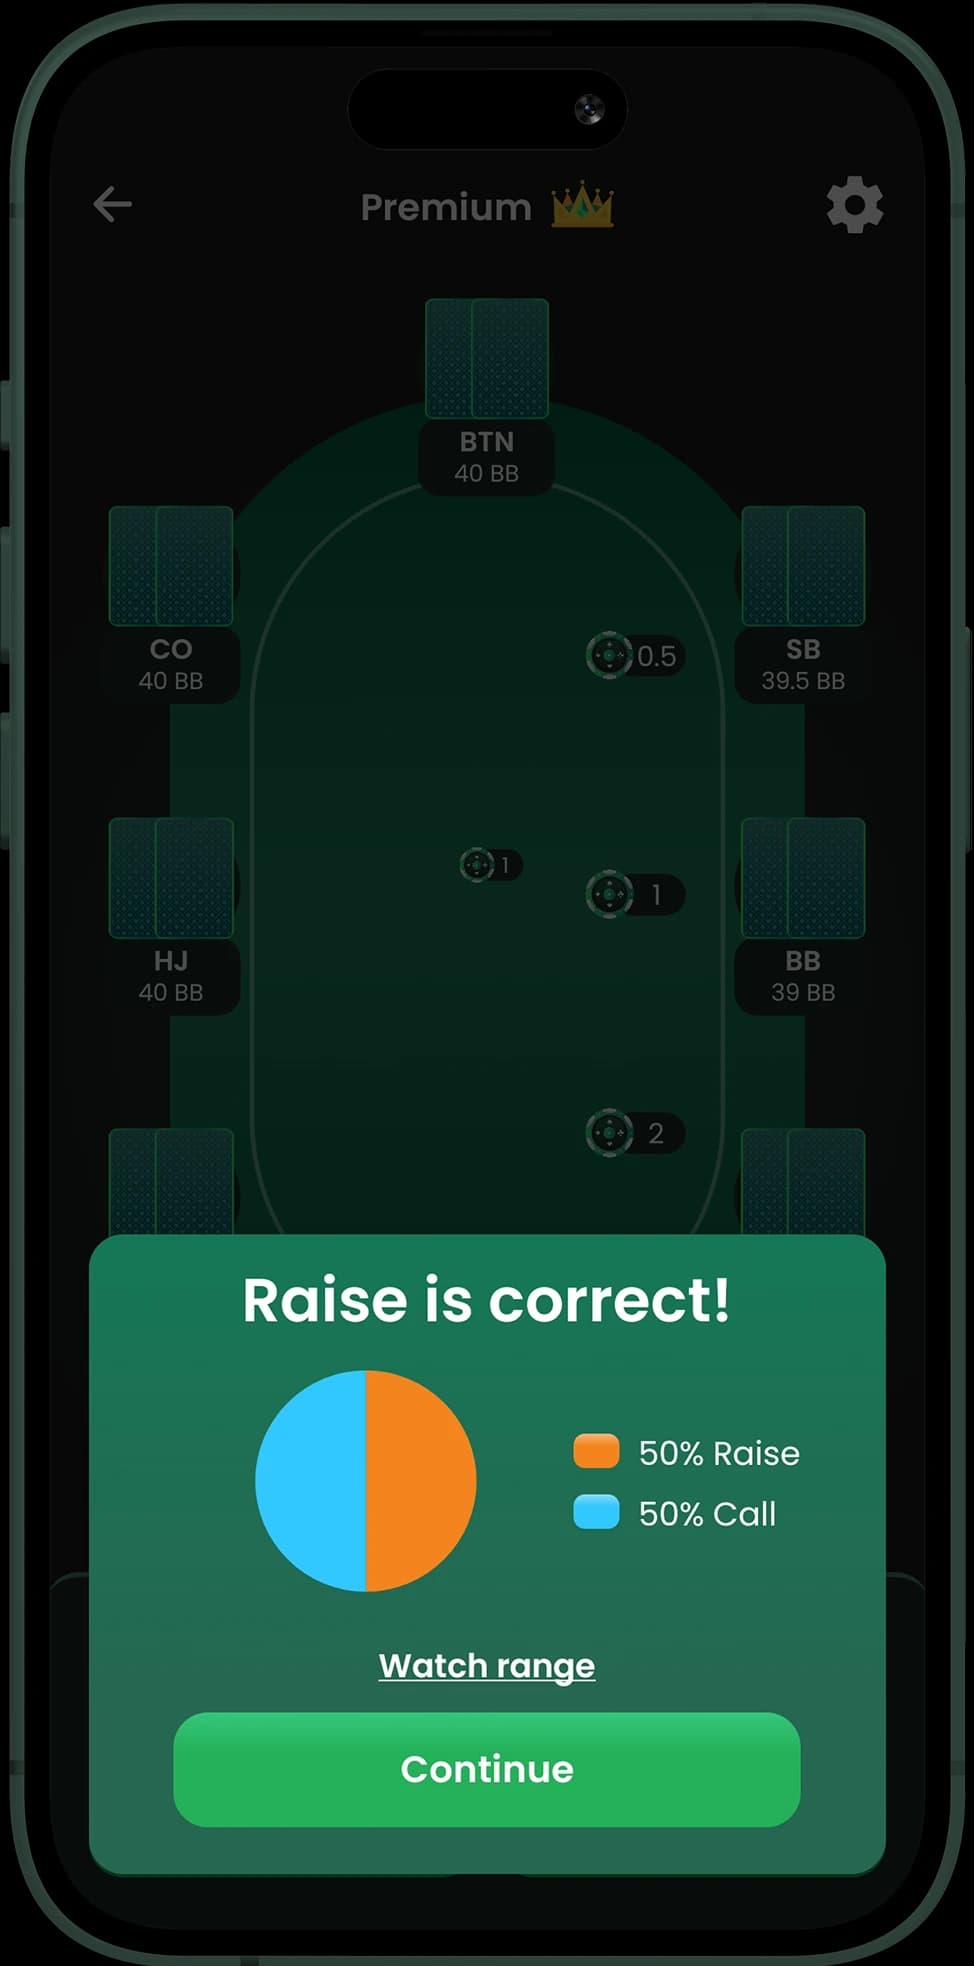
PFR stands for Pre-Flop Raise. It's the percentage of hands where you raise or re-raise preflop. PFR should always be close to — but slightly lower than — VPIP, because some hands worth playing are worth calling rather than raising. A VPIP/PFR gap of more than 5-6% usually indicates too much passive calling. A PFR significantly lower than VPIP suggests a 'calling station' tendency. Most winning players have a PFR between 17-24%, with a VPIP/PFR gap of 3-6%.
What Your Numbers Say If You're a Losing Player
The most common problem VPIP/PFR patterns
Pattern 1 — High VPIP, Low PFR (e.g. 40/8): Playing too many hands passively. This is the classic 'calling station' losing profile — entering too many pots in calling mode rather than raising mode. Pattern 2 — Very High VPIP, High PFR (e.g. 45/30): Playing too many hands aggressively. Raising lots but with a range that's too wide to sustain. Pattern 3 — Normal VPIP, Very Low PFR (e.g. 22/5): Playing reasonable hands but too passively — likely leaving money on the table by not 3-betting or isolating when appropriate.
Position Changes Everything: VPIP Should Not Be Uniform
Why a single VPIP number misses the most important dimension
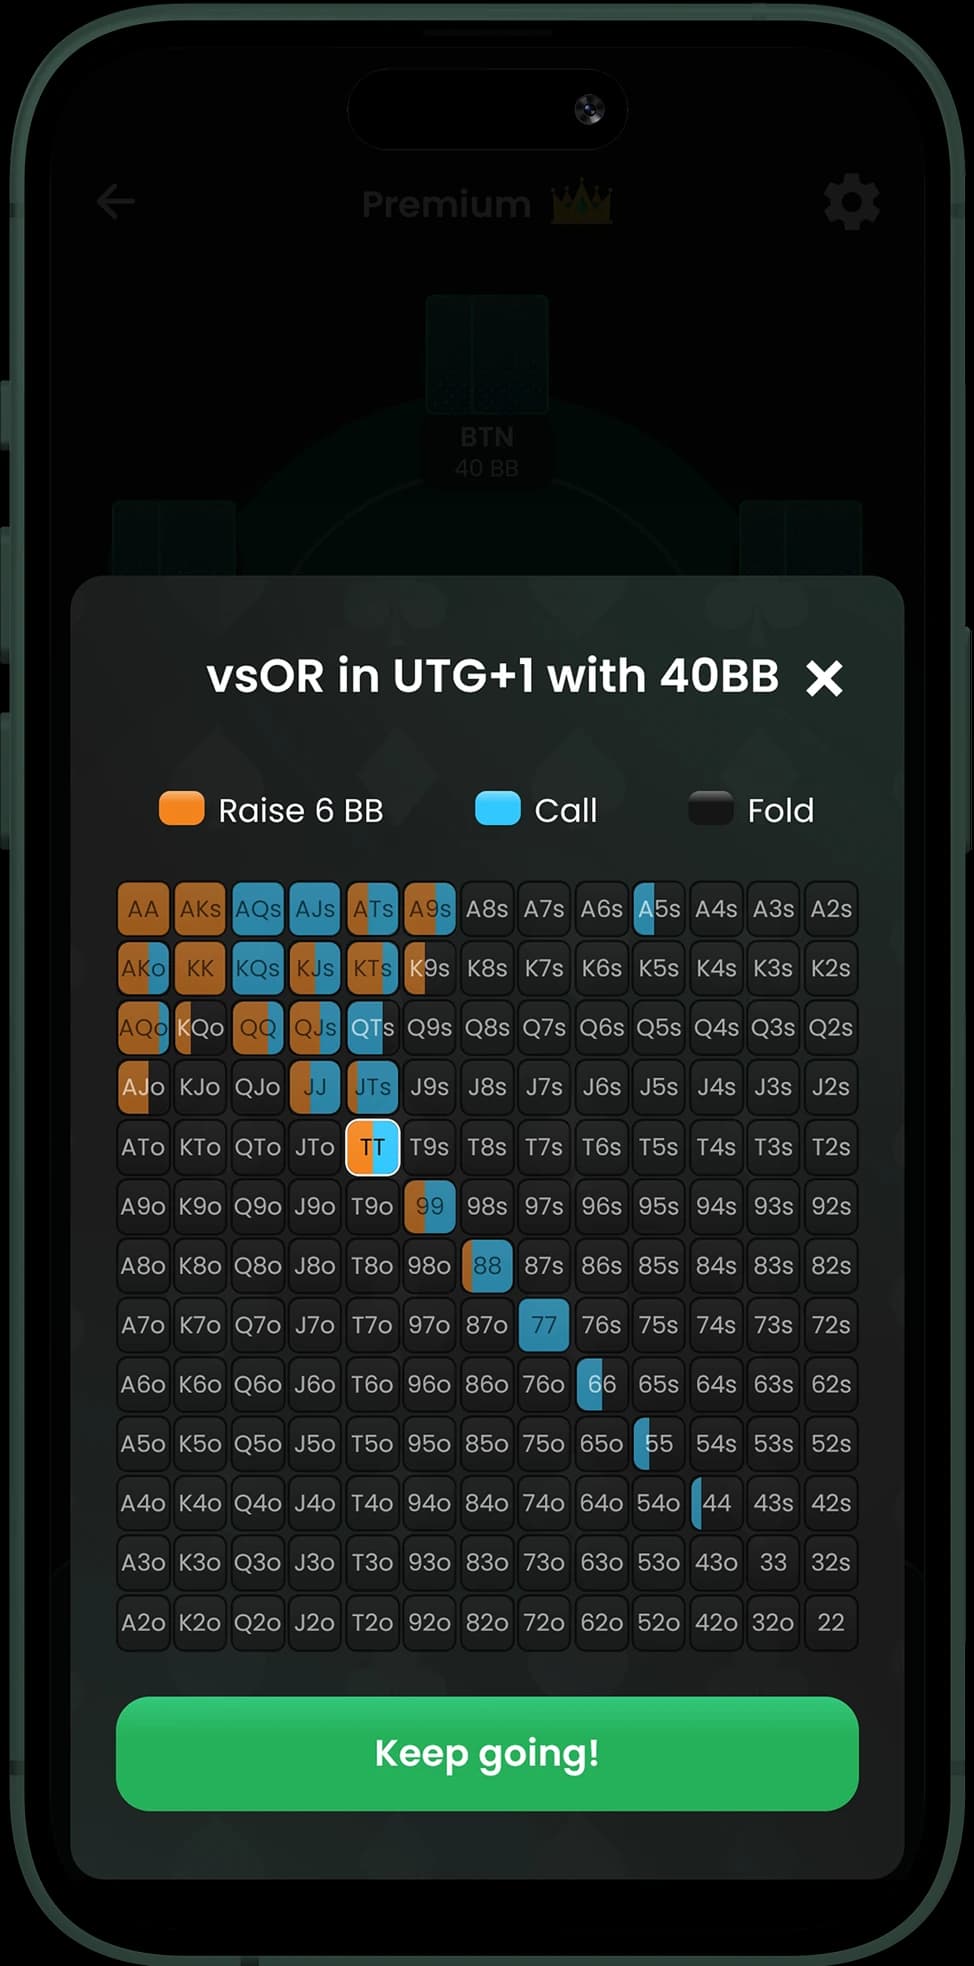
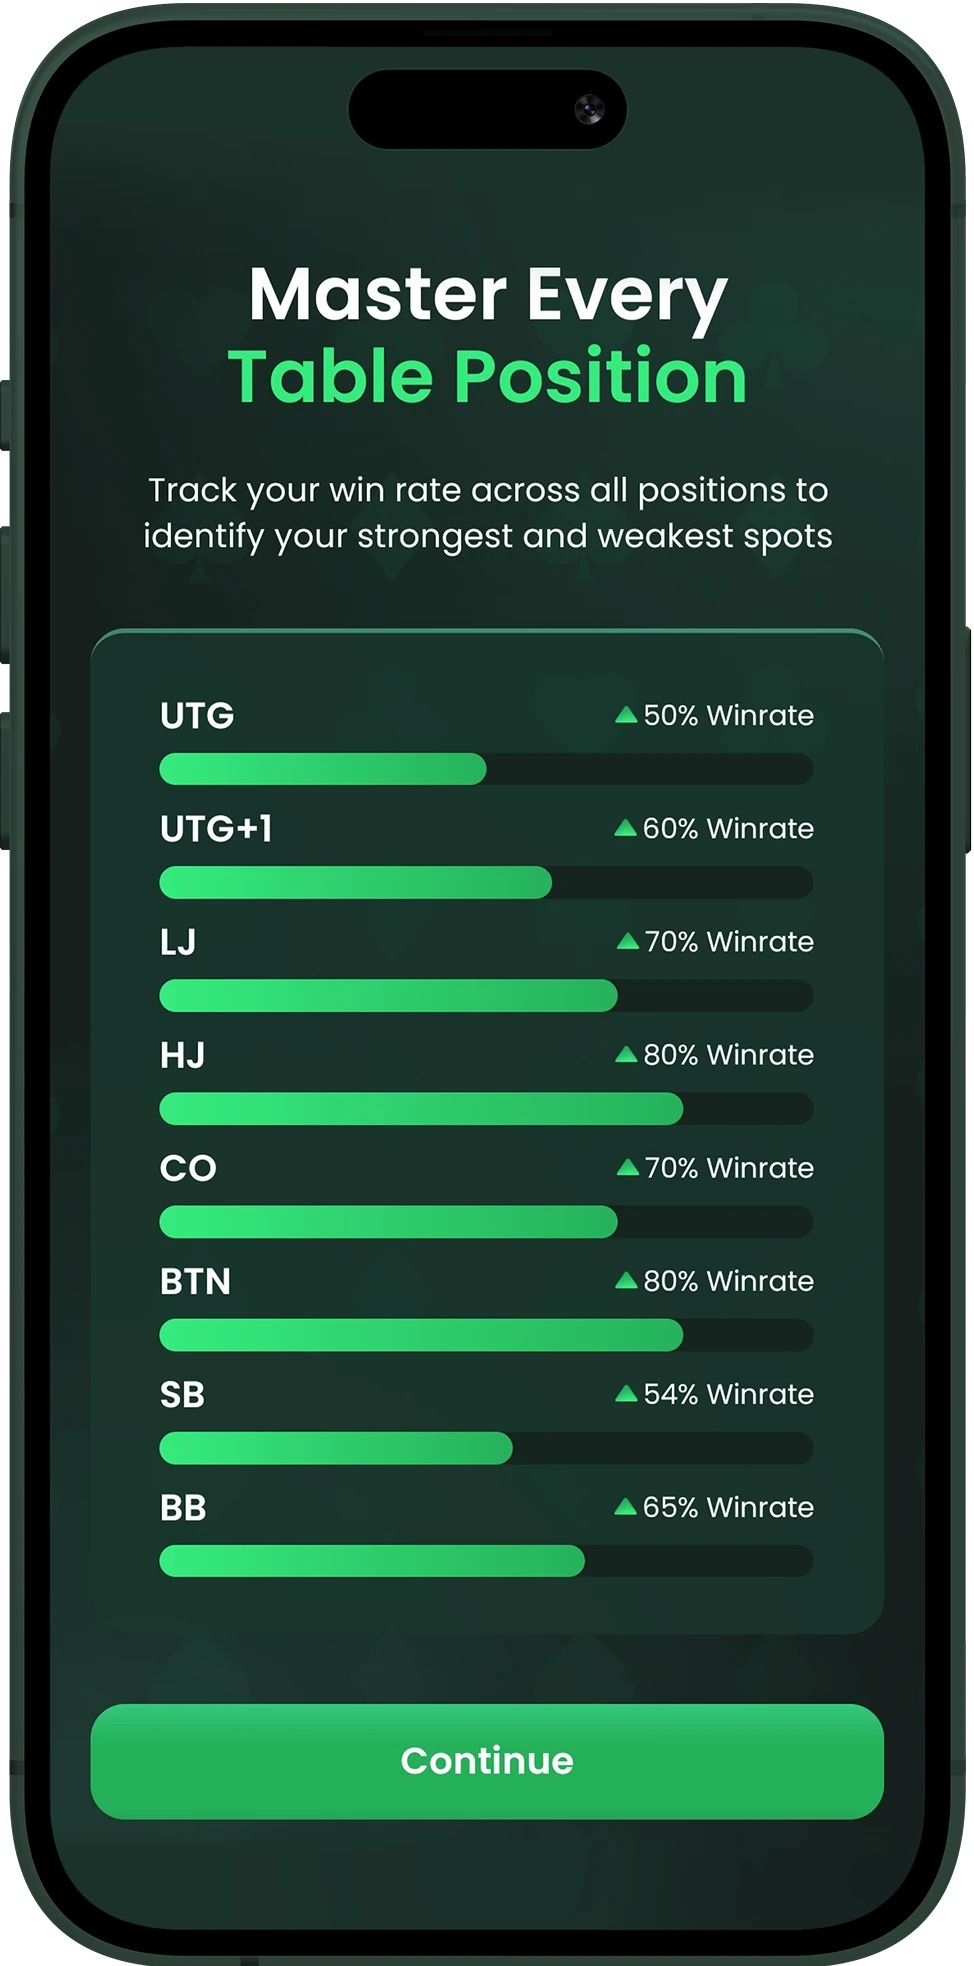
Overall VPIP doesn't tell the full story. What matters is VPIP by position. From UTG, a winning player might play 12-15% of hands. From the button, they might play 45-50%. A player with an overall VPIP of 25% could be playing correctly at every position, or they could be massively over-playing from early positions and under-playing from late positions. The distribution of VPIP across seats — not just the aggregate — is what reveals whether preflop ranges are properly calibrated.
Moving Your Numbers Toward Winning Ranges
The practical path from where you are to where you need to be
Most losing players need to move in one direction: tighter VPIP, higher PFR relative to VPIP. Specifically: fold more hands from early position, raise more and call less when you do play, 3-bet more strong hands instead of flatting. These changes feel uncomfortable at first because they mean folding hands that 'look good' and raising in spots that feel risky. But the data is unambiguous: players with VPIP/PFR profiles in the winning range outperform those outside it, across stakes and formats.
VPIP and PFR FAQ

Move Your Preflop Stats Toward Winning Ranges
Download PreflopAI and train position-specific ranges that fix your VPIP and PFR.